With the deployment of the DJI Matrice 30T, Droneview.be strengthens its services in professional drone inspections, surveying support and data-driven site monitoring.
This drone is not a traditional upgrade, but an integrated measurement platform combining inspection, mapping, thermography and distance measurement in one robust system.
For construction projects, property developers and architects where every centimeter matters, this technology makes a measurable difference.
For complex projects where every centimeter counts, the M30T truly makes the difference.
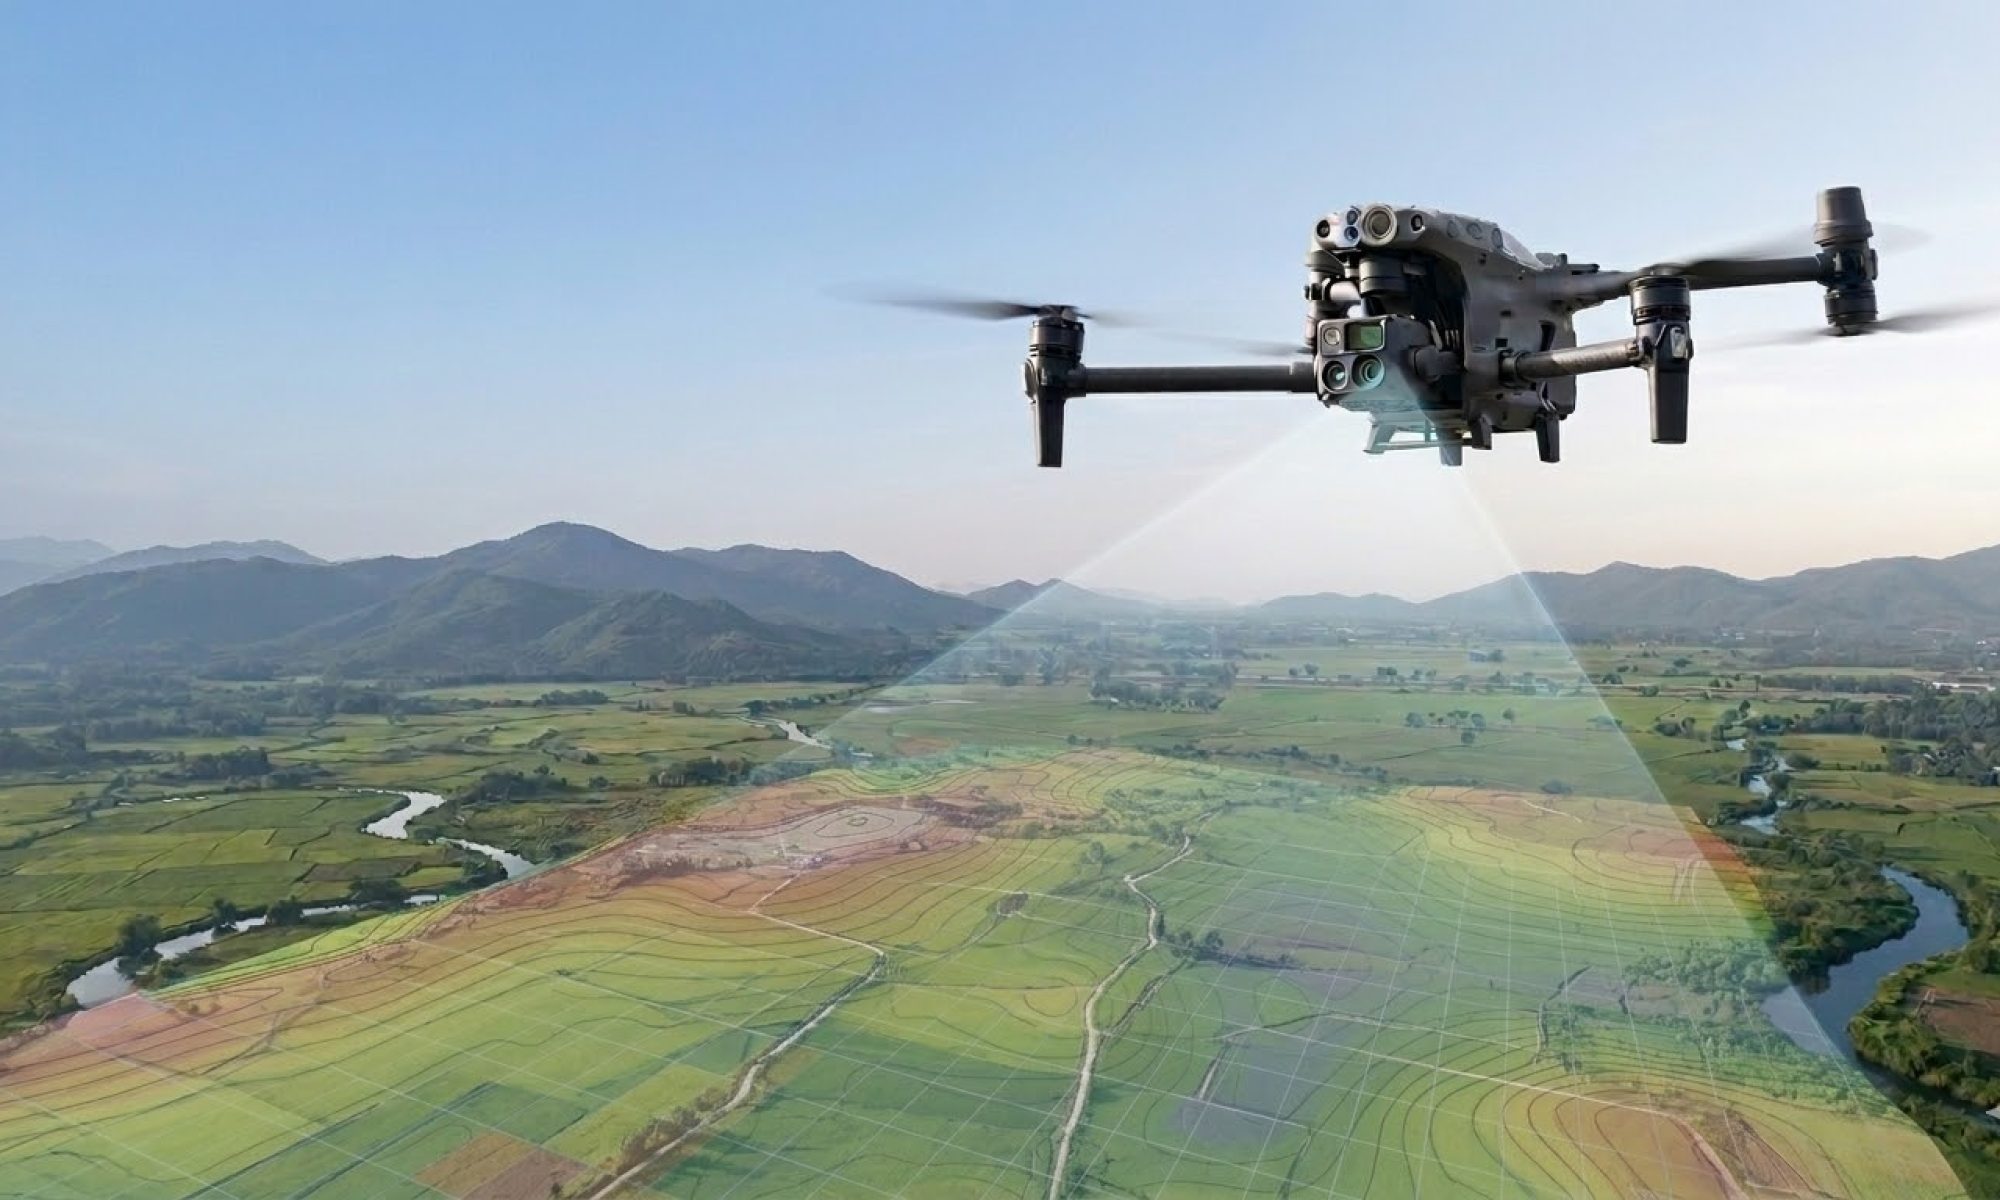
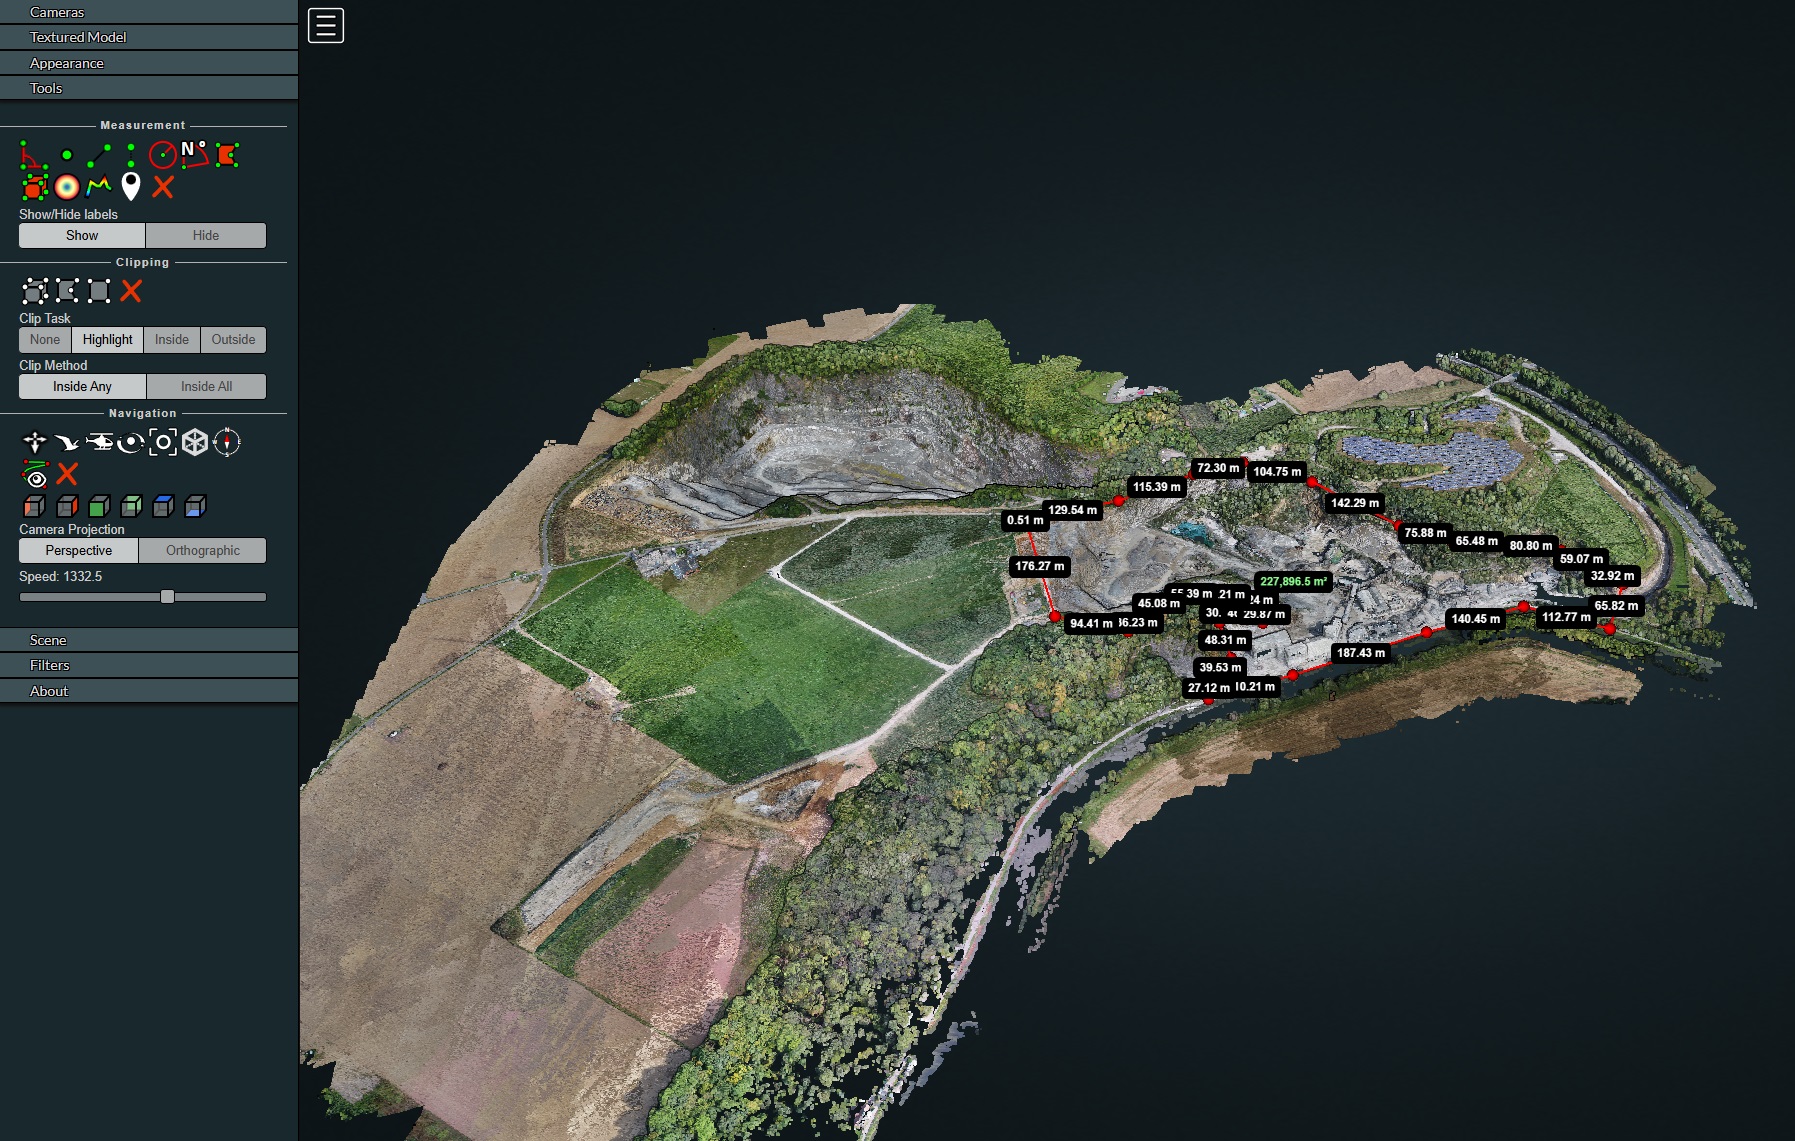
Centimeter-level mapping accuracy thanks to our own RTK station and FLEPOS
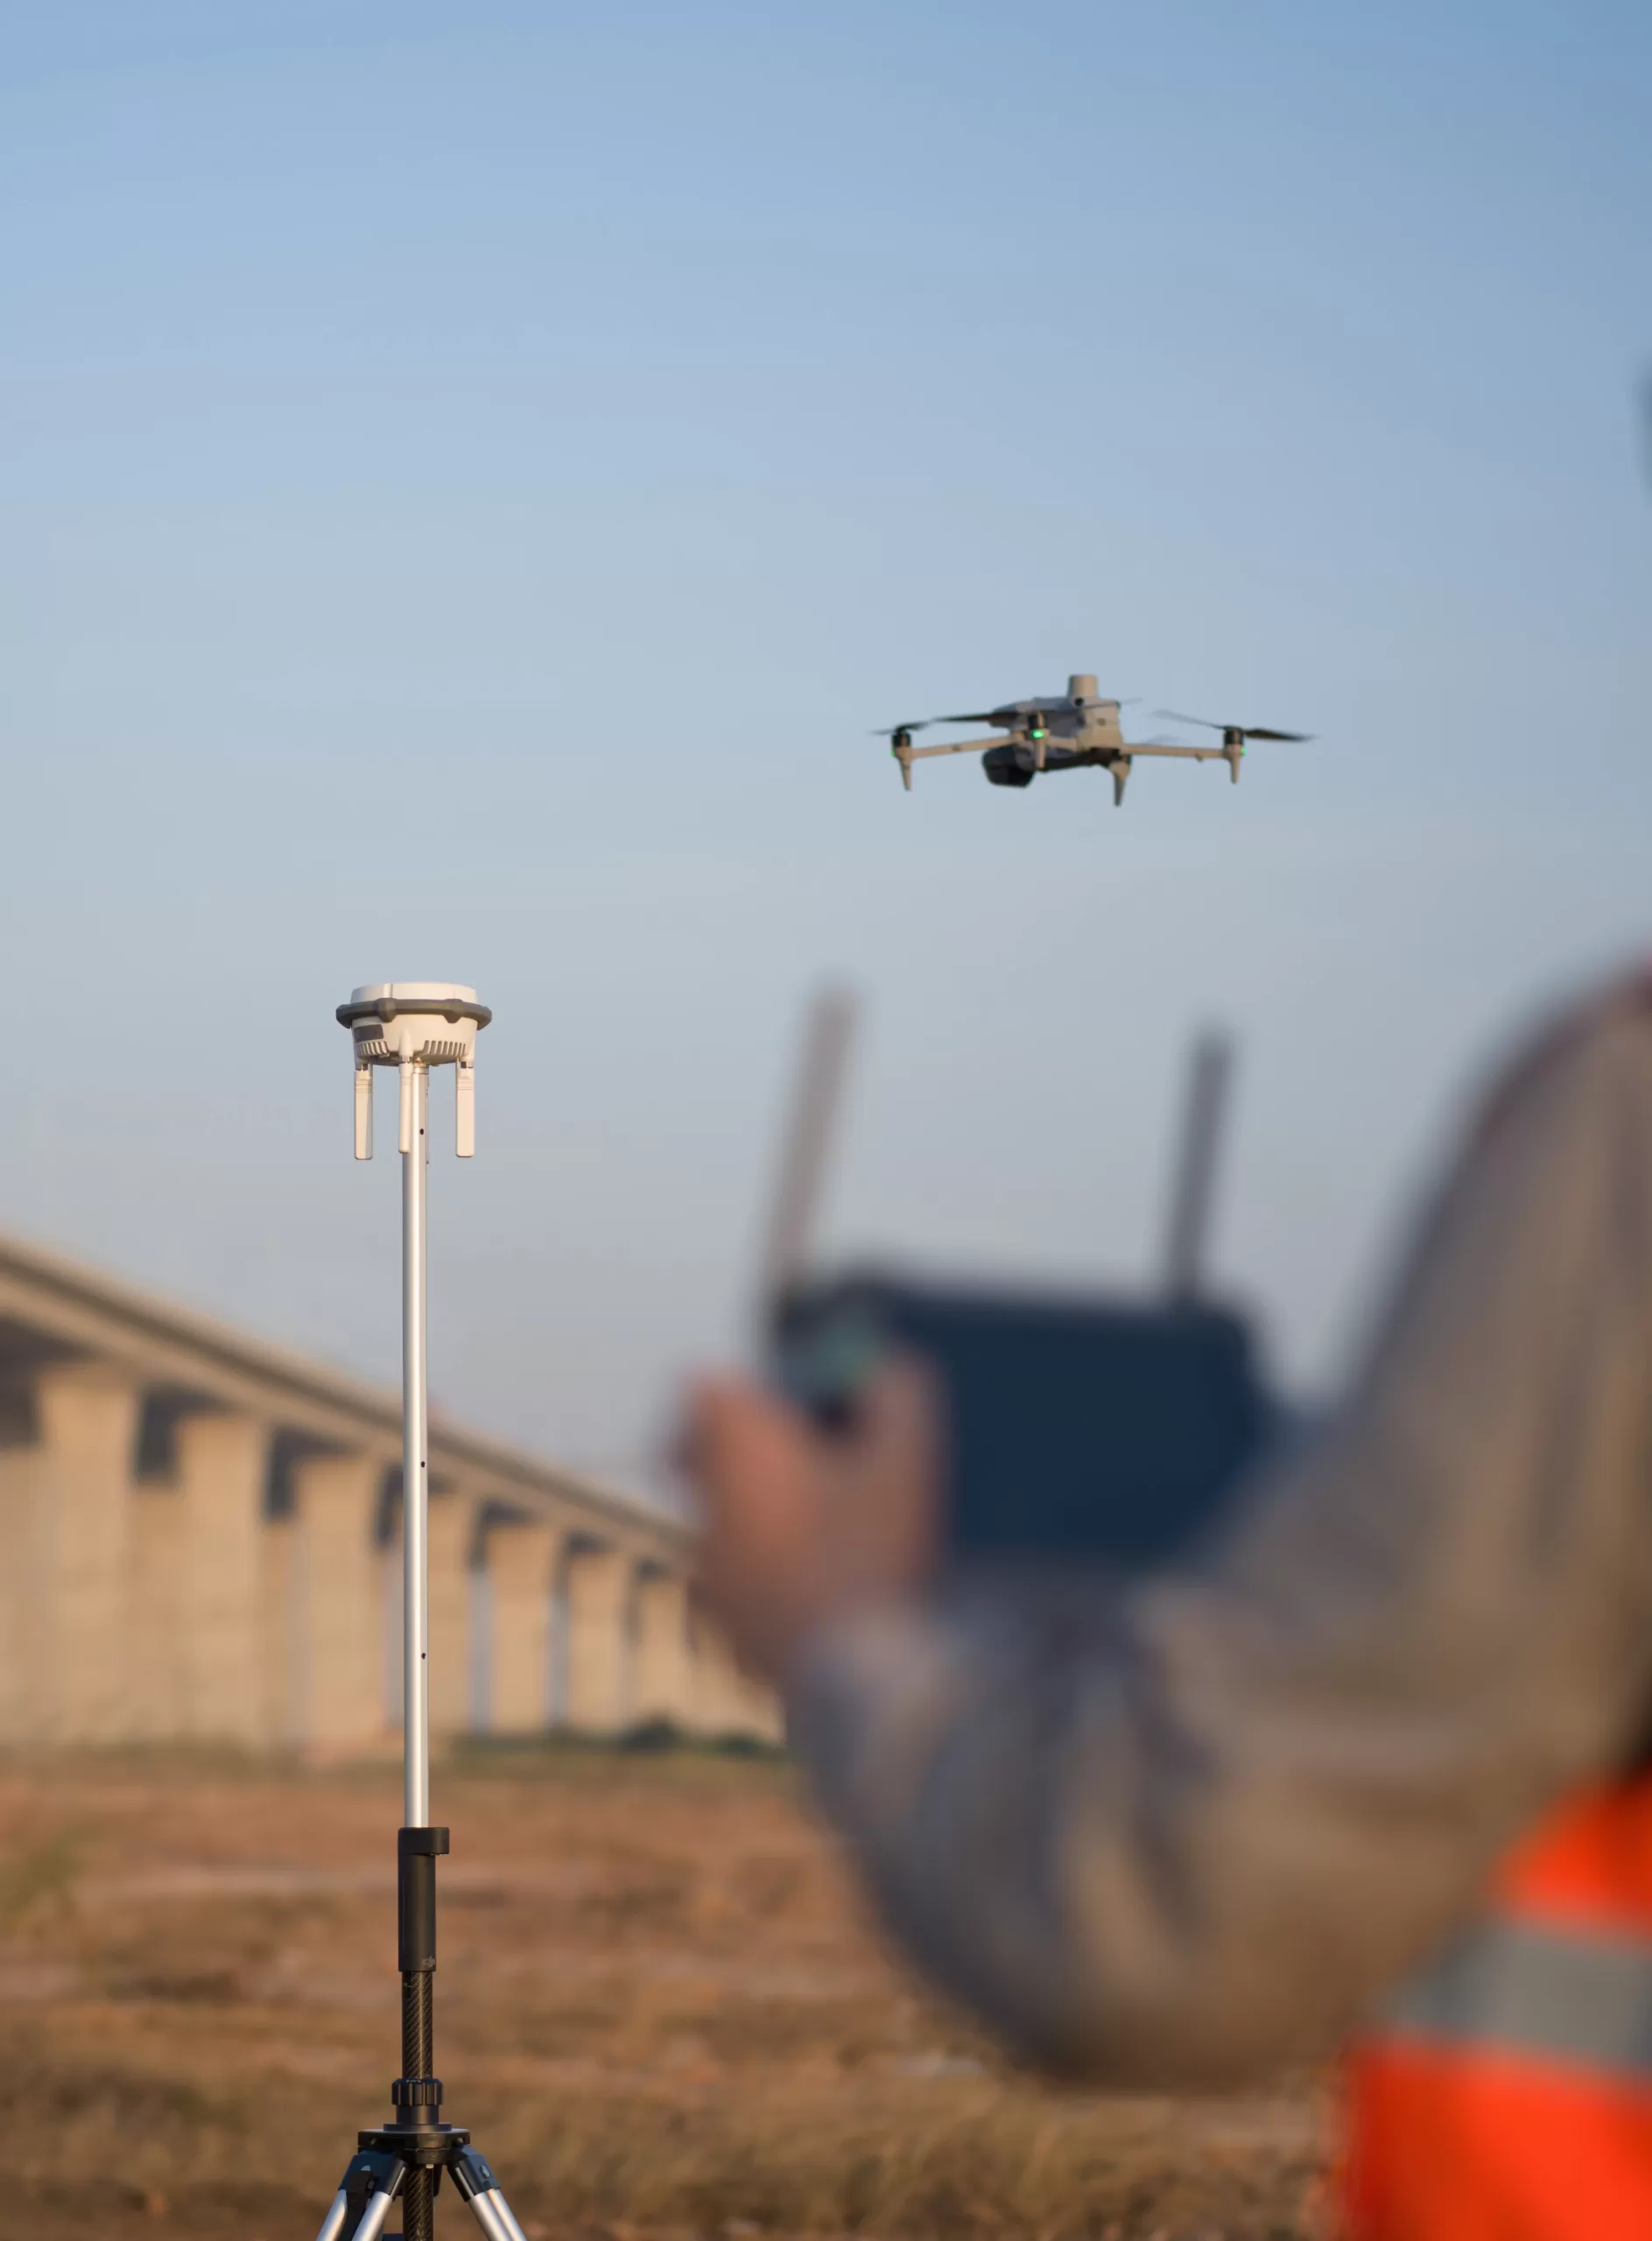
The M30T features built-in RTK (Real-Time Kinematic). For maximum accuracy, Droneview.be operates with a professional in-house RTK base station, connected to the Belgian FLEPOS reference network.
This combination allows us to achieve positioning accuracy of 1 to 3 centimeters, fully compliant with surveying standards.
Using our own RTK station means:
- Independent and stable correction signals
- Reliable operation in areas with limited network coverage
- Consistent measurement quality across multiple projects
- Reproducible datasets for periodic measurements
- This translates concretely into:
- Setting out and verifying earthworks
- Volume calculations of excavations and storage areas
- Parcel analysis for subdivisions and developments
- Digital Elevation Models (DEM) for drainage and sewer studies
- 3D terrain models for architectural integration
- As-built verification and comparison with design plans
Engineering firms and architects receive reproducible measurement data directly usable for further engineering.
Thanks to RTK support, the number of ground control points is reduced, speeding up site acquisition and improving processing efficiency.
RTK applications beyond drone flights
Our RTK base station is not exclusively used for drone flights. The system can also be deployed independently for precision positioning and ground-based surveying.
Possible applications:
- Surveying reference and control points (GCPs)
- Setting out building lines and axes
- Foundation height verification
- Positioning utilities and technical infrastructure
- Preparation of surveying documentation
- Support for subdivision and infrastructure projects
For developers, contractors and architects, this means one integrated measurement system can be used throughout all project phases: from design and earthworks to final delivery.
By combining aerial data and ground measurements, a coherent and verifiable measurement framework is created, significantly reducing discussions about heights, volumes or positioning.
Support for property development and architecture
For developers and architects, the M30T offers key advantages in both the design and execution phases:
Preliminary design & feasibility studies
- Detailed terrain analysis
- Contour lines and slope gradients
- Integration of buildings into existing topography
Execution phase
- Verification of staked foundations
- Earthmoving monitoring
- Design vs. construction comparison
Delivery phase
- As-built 3D models
- Documentation for technical files
This allows a large part of site verification to be carried out digitally and objectively, without permanent presence on site.
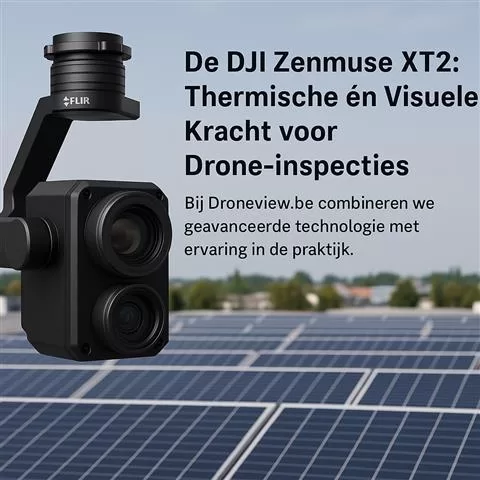
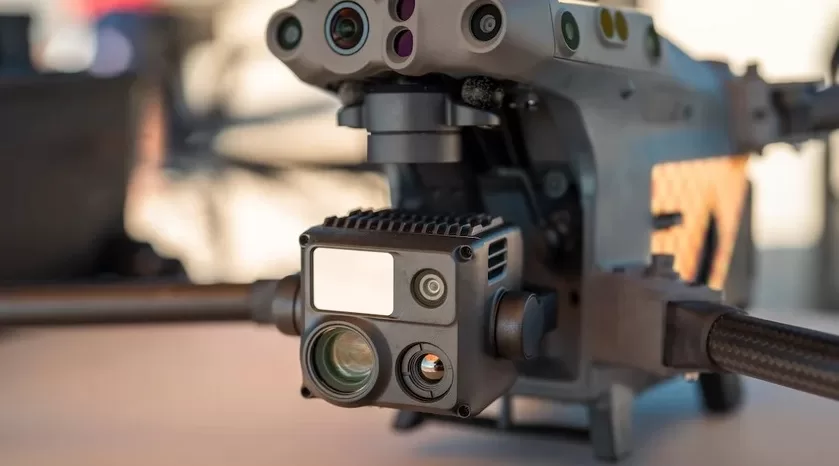
Triple-camera system: visual, thermal and zoom in one flight
What makes the M30T unique is the integration of multiple sensors in one compact payload.
During a single mission we automatically capture:
- Wide images
- Zoom images
- Thermal images
Wide Camera
- 12 MP
- 1/2” CMOS sensor
- Ideal for overview and mapping
Zoom Camera
- 48 MP
- 5x optical zoom
- Up to 16x hybrid zoom
- Up to 200x maximum digital zoom
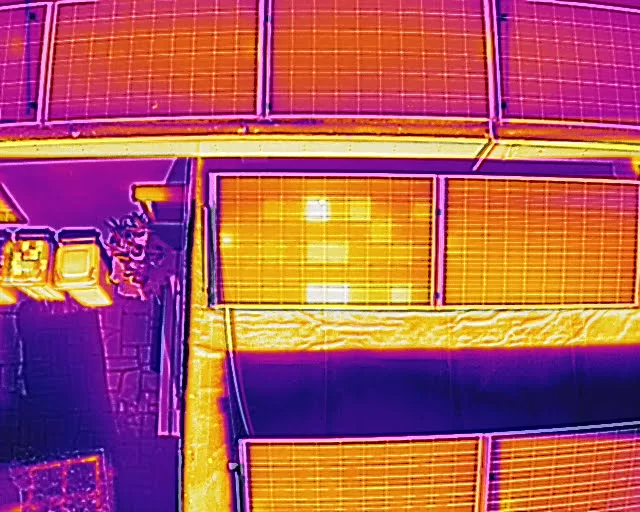
For inspections of masts, wind turbines, facades or industrial installations, we remain at a safe distance while still analyzing microscopic details.
High-Res Grid: extreme resolution without risk
With the High-Res Grid function, the drone automatically scans a selected area and combines multiple 48 MP zoom images into one ultra-high-resolution image.
Result:
- Exceptional level of detail
- No risk from flying close to structures
- Ideal for facade inspections and technical analysis