Introduction: Beyond the Drone Flight: What Matters is the Usable Report
Solar panels are a long-term investment, but their performance can decline annually due to hidden defects. A drone inspection is a fast and safe way to map the health of your installation. However, raw thermal images or a long list of photos are often insufficient for a manager or owner.
At Droneview.be, we know: the true value of an inspection is not in the flight, but in the structured report you receive. We ensure that every hotspot and defect is translated into a direct actionable step.
Step 1: Data Collection – What the Drone Sees
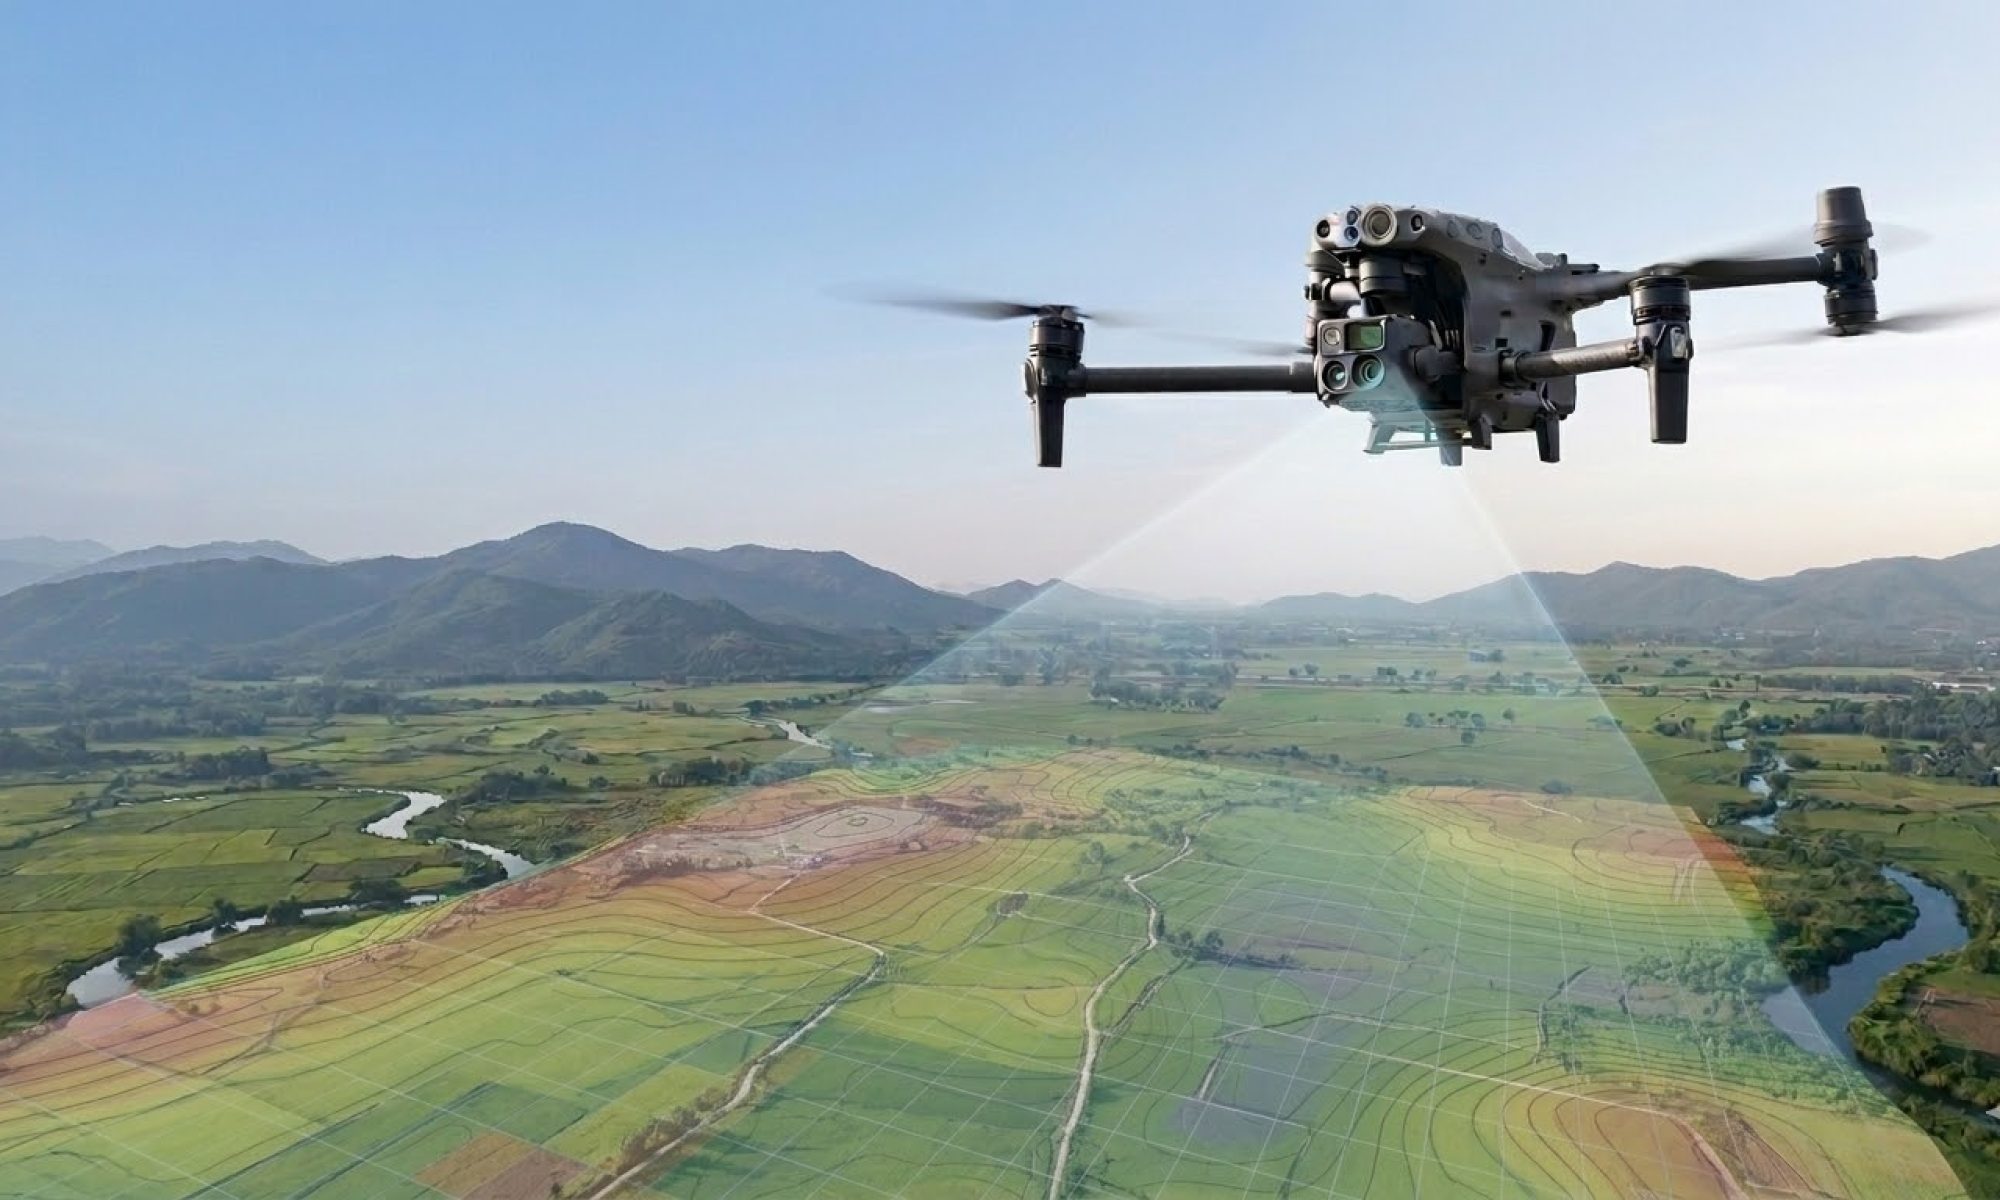
Our specialized drones (equipped with cameras such as the DJI Zenmuse XT2) collect two crucial data streams simultaneously:
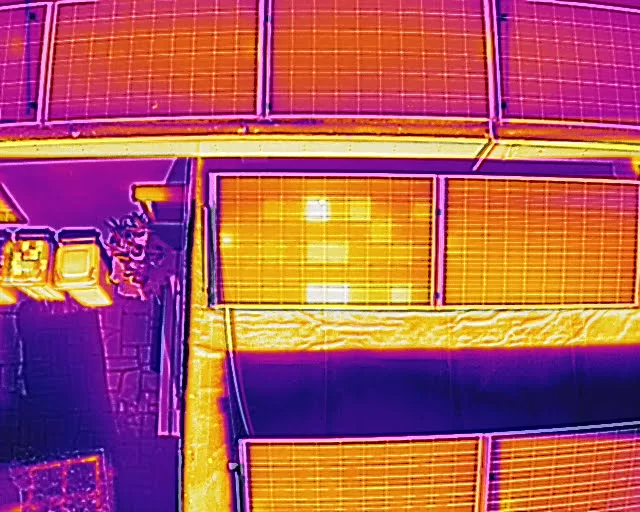
- Thermal (IR) Images: These record heat differences. A defective solar cell, a broken bypass diode, or a poor connection emits heat and appears as a bright ‘hotspot’ in the image. This is the primary source of defect detection.
- Visual (RGB) Images: These 4K images provide the visual context. They are essential for identifying physical damage (such as cracks) or contamination (such as bird droppings or leaves).
In addition, each image is provided with accurate GPS coordinates (Geotagging). This is the key to quickly locating and repairing defects on your large installation.

Step 2: The Analysis – From Hotspot to Defect
Once the flight is completed, the crucial analysis phase follows. Here we convert thermal anomalies into actionable findings. The most common defects we identify are:
| Defect | Cause | Impact on Yield |
| 1. Hotspots | Defective cell or broken bypass diode. | Limits current through the entire string; can pose a fire hazard. |
| 2. Shading & Contamination | Shadow from objects or heavy dirt accumulation. | Direct yield loss in the affected area. |
| 3. PID (Potential Induced Degradation) | Voltage differences and long-term moisture exposure. | Gradual but significant and permanent power loss. |
| 4. Wiring Faults | Poor connections in junction boxes. | Local heat loss, indicating resistance and efficiency loss. |